Sunday Review
A weekly look at how price behaved and what I’m watching for the week ahead. Free, every Sunday.
Sunday Review - October 18, 2026
Here is how the week closed and what I'm watching next.
Where the indexes closed
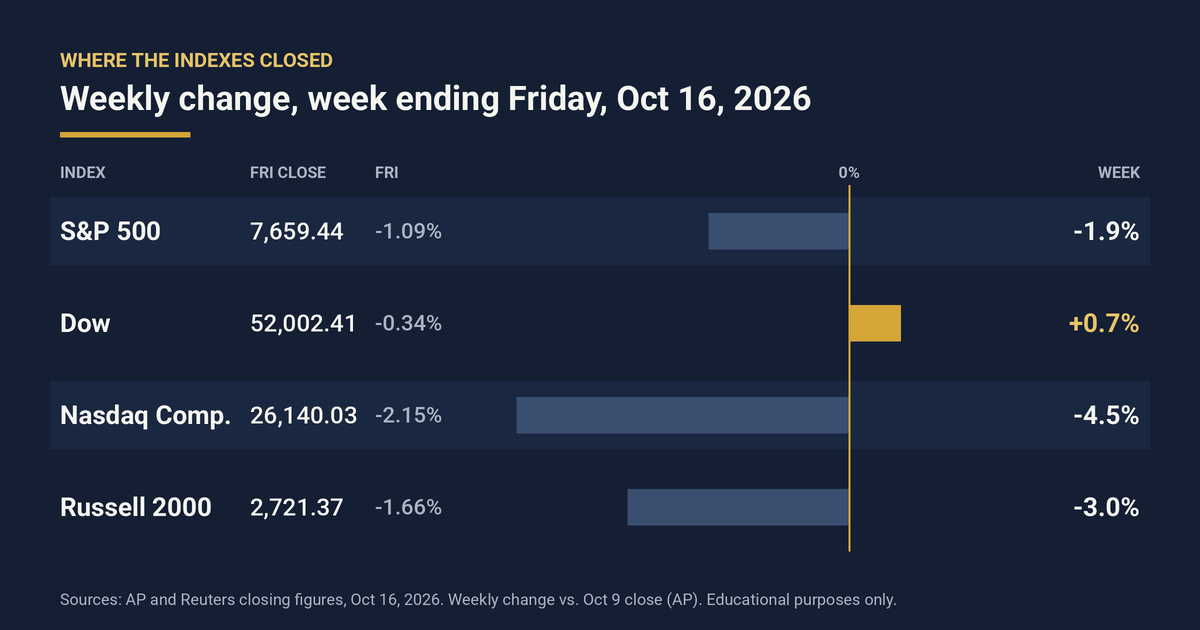
Friday closes and weekly change for the four major U.S. indexes.
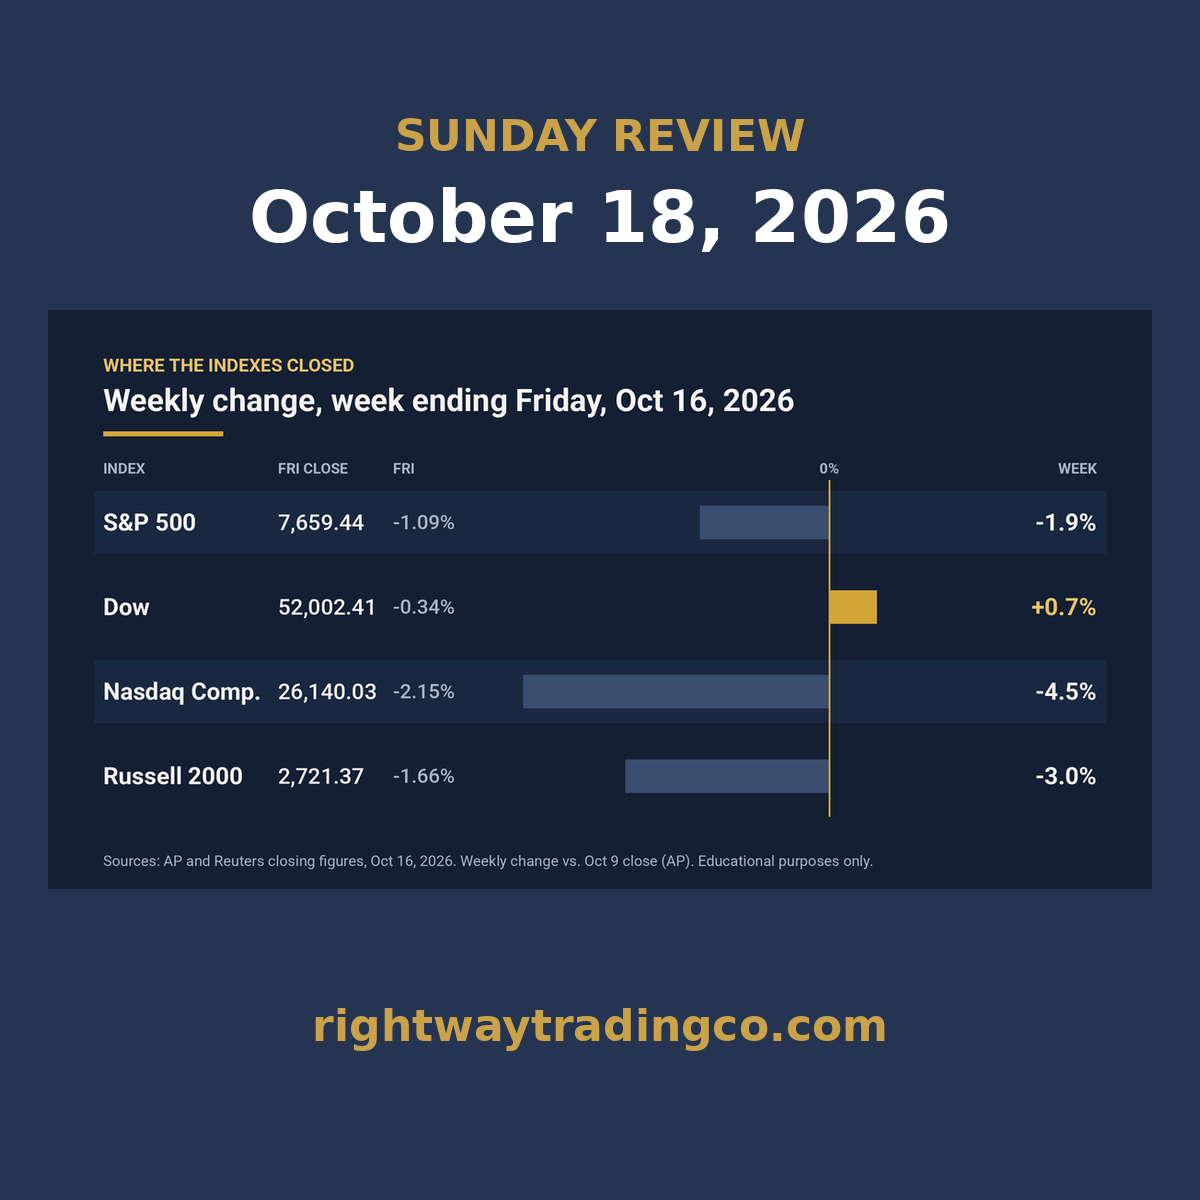
The S&P 500 finished Friday at 7,659.44, down 1.09% on the day and 1.9% on the week. The Dow closed at 52,002.41, down 0.34% Friday but up 0.7% for the week. The Nasdaq Composite ended at 26,140.03, down 2.15% Friday and 4.5% for the week. The Russell 2000 closed at 2,721.37, down 1.66% Friday and 3.0% for the week.
The S&P 500 and the Nasdaq both posted their worst week since June. The Dow was the exception and finished the week higher.
How price behaved at the levels that mattered
Last week I had two S&P 500 levels on my screen. The 7,818.93 record close sat overhead, and 7,765.36 sat beneath. Price never got back to the record. The index held near 7,805 through Tuesday, then broke below 7,765.36 on Wednesday and closed at 7,718.94.
Then the old floor started acting like a ceiling. Thursday's rebound reached 7,754.15 and stalled under 7,765.36. Friday's high of 7,756.84 stalled there again, and the index closed near the day's low of 7,631.77. Two failed tests of the same level in two days is information. It is not a forecast.
The Nasdaq never challenged its 27,599.79 record and finished about 5.3% below it. Friday's intraday low on the Nasdaq was 26,023.10.
What showed beneath the surface
The damage was concentrated, not uniform. Within the S&P 500, 249 stocks rose and 254 fell Friday, close to even. Advancing volume was only 41%, so the heavier money sat on the sell side. Eighteen S&P 500 stocks were near 52-week highs and one was near a low. About 69% of S&P 500 stocks closed above their 20-day average, but only about 46% held above their 50-day.
Sector leadership turned defensive. Energy led at +2.52%, followed by utilities at +1.34% and consumer staples at +1.08%. Technology fell 3.02% and communication services fell 1.89%. AI infrastructure and chip stocks took the hardest hits, and the PHLX chip index fell for an eighth straight session. When the index drops hard while the average stock is close to flat, a handful of large names are doing the work. I want to see whether that selling spreads or stays contained.
Volatility woke up. The VIX closed at 19.99, up 3.53 points Friday and up from 14.84 a week earlier.
Rates eased, even after hotter-than-expected consumer and producer inflation reports this week. The 10-year Treasury yield finished Friday at 5.09%, down from 5.24% a week earlier. The 2-year finished at 4.74%, down from 4.80%. Reuters reported that investors moved toward the safety of government debt as AI financing worries grew.
Oil is the input I'm watching most closely. WTI settled at $101.41, up 3.5% Friday and about 10% for the week. Brent settled at $109.86, up 3.7%, on Middle East and Russian supply concerns. Comex gold settled at $4,159.50, up 0.28% Friday but down 0.75% for the week. The dollar index closed at 101.78, down 0.19%, and logged its first weekly decline in five weeks.
Special focus: Netflix, Tesla and Meta earnings
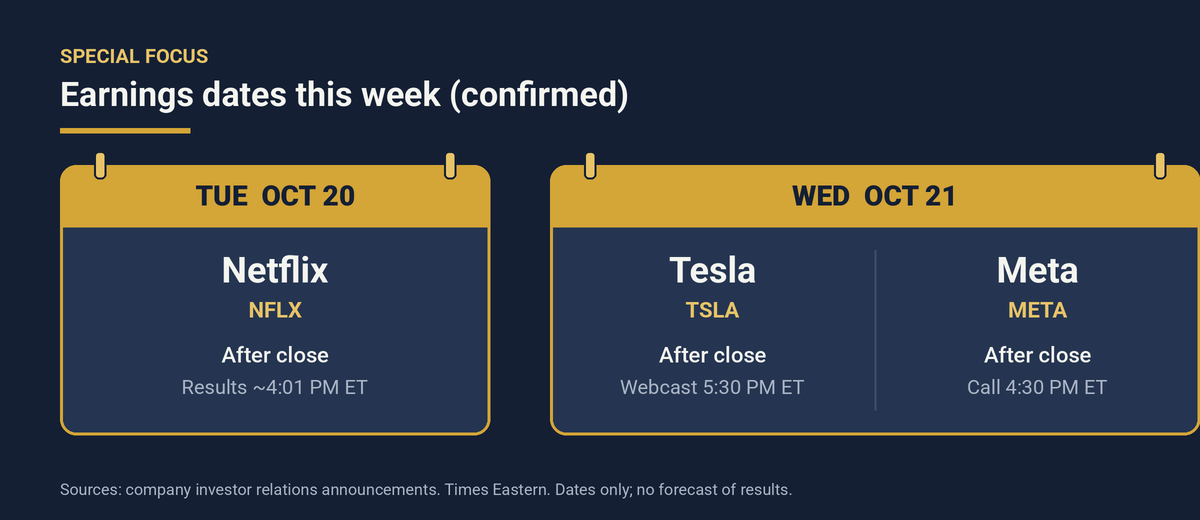
Confirmed report dates and times (Eastern).
Three of the most widely watched names report this week. Here are the confirmed dates and where each stock closed Friday. I am not forecasting any of these reports.
Netflix (NFLX): Tuesday, October 20, after the close. Results post at about 4:01 PM ET, and the management video interview starts at 4:45 PM ET. The stock closed Friday at $70.53, down 2.86%, after Netflix named Peter Rice its new chief content officer. That close sits below both its 50-day average near $75 and its 200-day average near $83.
Tesla (TSLA): Wednesday, October 21, after the close. The question and answer webcast starts at 5:30 PM ET. The stock closed Friday at $354.72, down 2.13%, after giving back an early gain tied to its Roadster reveal. It finished the week down about 7%, just under its 50-day average near $359 and below its 200-day near $388.
Meta (META): Wednesday, October 21, after the close, the same evening as Tesla. I checked this one. Meta is not reporting the following week. Its conference call is at 4:30 PM ET. The stock closed Friday at $709.33, down 3.72%. That is about 9% below its September 24 high of $779.82 and still above its 50-day average near $653.
With Tesla and Meta reporting the same evening, both reactions arrive at Thursday's open. That is a lot of index weight moving on one night of headlines.
The week ahead: what I'm watching
Monday is a light day for U.S. economic data. The bigger scheduled data arrives Tuesday, Thursday and Friday.
Monday: NAHB housing market index at 10:00 AM ET. Fifth Third reports before the open, and Steel Dynamics reports after the close.
Tuesday: September housing starts and building permits at 8:30 AM ET, and pending home sales at 10:00 AM ET. GE, GM, 3M, RTX and Northrop Grumman report before the open. Netflix, Capital One, Intuitive Surgical and United Airlines report after the close.
Wednesday: AT&T, Thermo Fisher, Philip Morris and CME Group report before the open. Tesla, Meta, IBM, Texas Instruments and Lam Research report after the close.
Thursday: Weekly jobless claims at 8:30 AM ET and leading indicators at 10:00 AM ET. Procter & Gamble, Honeywell, Lockheed Martin, Union Pacific, Blackstone and American Airlines report before the open.
Friday: Flash S&P Global PMIs at 9:45 AM ET and the final University of Michigan sentiment reading at 10:00 AM ET. American Express and SLB report before the open.
The Fed's next policy decision is October 27 and 28, the following week. Chair Warsh did not signal the outcome on Friday.
The levels on my screen: On the S&P 500, 7,765.36 overhead, the level that capped Thursday and Friday, then the 7,818.93 record. Beneath, Friday's low of 7,631.77. On the Nasdaq, Friday's low of 26,023.10. On the VIX, the 20 area. On rates, 5.09% on the 10-year. On oil, $100 on WTI and $110 on Brent.
None of this is a forecast. It is where price is and what is on the calendar. Let the first reaction show where buyers and sellers defend price. Wait for confirmation at the levels, control risk, and remember that cash is a position.
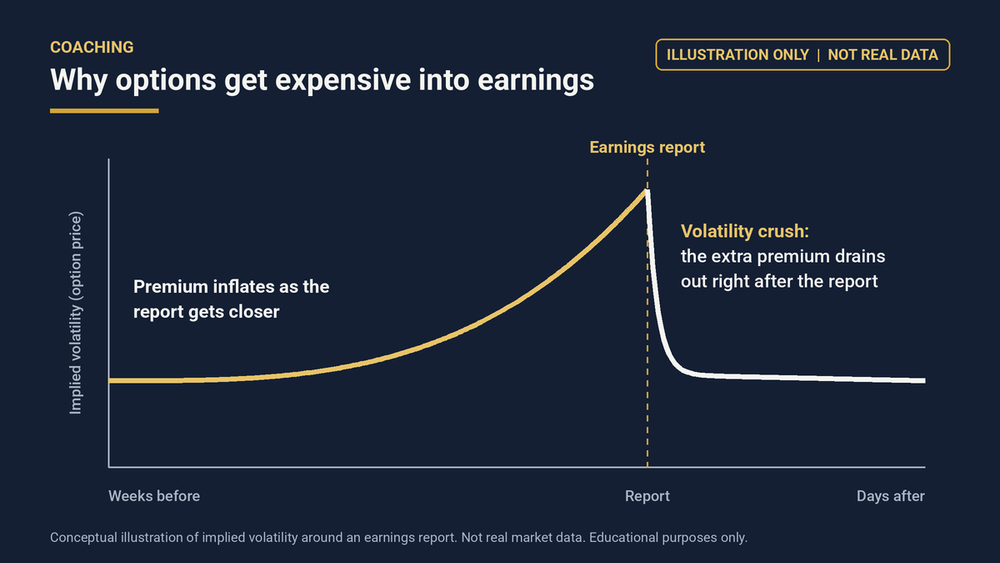
Start every trading day prepared. My free Market Prep Center gives you the market story, the decision windows, the economic reports, notable earnings and a market internals snapshot, all in one place before the open. It updates at 5:30 AM, 12:30 PM and 4:30 PM ET, so a quick refresh shows you the latest. With Netflix, Tesla and Meta all reporting this week, it's a good week to start.
Doug
Educational purposes only. Nothing provided by Right Way Options constitutes investment advice or a recommendation to buy or sell any security. Trading involves risk.
Sunday Review - October 11, 2026
Here is how the week closed and what I'm watching next.
Where the indexes closed
The S&P 500 finished Friday at 7,811.54, up 0.59% on the day and 1.2% on the week. The Dow closed at 51,654.95, up 0.83% Friday and 0.9% for the week. The Nasdaq Composite ended at 27,366.17, up 0.64% Friday and 0.6% for the week. The Russell 2000 closed at 2,806.98, up 0.46% Friday but down 0.9% for the week.
How price behaved at the levels that mattered
The level that defined the week was Tuesday's record close of 7,818.93 on the S&P 500. Price set that mark Tuesday, pulled back two sessions to a 7,765.36 close Thursday, then rebounded Friday to finish 0.09% below it. That is the second highest close in the index's history, but it is not a new high. The Nasdaq followed a similar path and closed Friday under its Tuesday record of 27,599.79. Large caps carried the week. Small caps did not follow.
What showed beneath the surface
Participation improved Friday. NYSE advancers led decliners 1.65 to 1, and Nasdaq advancers led 1.38 to 1. The detail I keep coming back to is new lows. The NYSE logged 141 new highs against 183 new lows, and the Nasdaq logged 41 new highs against 209 new lows. Volume was 14.37 billion shares, below the 20-day average of 17.76 billion. An index near a record with more new lows than new highs and light volume is a narrow move, and I treat it that way.
Ten of the 11 S&P 500 sectors rose. Communication services was the lone decliner after SpaceX agreed to buy a nationwide low-band spectrum portfolio, and T-Mobile, AT&T and Verizon fell between 8.8% and 13.3%.
Volatility stayed quiet. The VIX closed at 14.84, down 3.7%.
Rates remain the constraint. The 10-year Treasury yield closed Friday near 5.24% after trading as high as about 5.36% on Wednesday, its highest level since 2002. The 2-year finished near 4.79%. Stocks are pressing records with the 10-year above 5.2%, and that deserves respect.
Oil held firm. WTI settled at $91.85 and Brent at $104.72 as Gulf production shutdowns tied to Hurricane Isaias offset earlier relief around Iran. Gold was near $4,194 an ounce Friday afternoon, up about 1.5%. The dollar index closed at 102.23, up 0.09%.
The week ahead: what I'm watching
Monday, October 12 is Columbus Day. Stocks trade a normal session, but the bond market and banks are closed and the Fed's scheduled releases move to Tuesday. With rates not trading, Monday can be a thinner session than usual. I'll let the open settle before I trust it.
Tuesday: Third quarter earnings season starts with JPMorgan Chase, Goldman Sachs, Citigroup and Wells Fargo, along with Johnson & Johnson and UnitedHealth.
Wednesday: September CPI at 7:30 AM CT. Bank of America and Morgan Stanley report.
Thursday: September retail sales and PPI at 7:30 AM CT, plus the Philadelphia Fed survey. Taiwan Semiconductor, Charles Schwab, PNC, BNY Mellon and Prologis report.
Friday: Import and export prices at 7:30 AM CT and monthly options expiration. Travelers, Truist, Regions, M&T and Citizens report.
The levels on my screen: 7,818.93 on the S&P 500, the record close overhead, and 7,765.36, Thursday's close beneath. On the Nasdaq, the 27,599.79 record. On rates, 5.24% on the 10-year and the 5.36% high from Wednesday. On oil, $90 on WTI and $100 on Brent.
None of this is a forecast. It is where price is and what is on the calendar. CPI and the bank reports will move things, and I don't need to guess which way. Let the first reaction show where buyers and sellers defend price, wait for confirmation at the levels, control risk, and remember that cash is a position.
Doug
Educational purposes only. Nothing provided by Right Way Options constitutes investment advice or a recommendation to buy or sell any security. Trading involves risk.