Here is how the week closed and what I'm watching next.
Where the indexes closed
The S&P 500 finished Friday at 7,376.86, up 0.31% on the day but down 2.7% for the week, its worst week since April 2025 and its fourth straight weekly loss. The Nasdaq Composite gained 1.09% Friday to 24,579.42 and lost 3.4% for the week, its fourth weekly decline in a row. The Dow closed at 51,285.73, down 0.46% Friday and 0.9% for the week. The Russell 2000 rose 0.89% Friday to 2,754.11 and fell 2.1% for the week.
It was an election week, and the market changed its mind in a hurry. Wednesday, the day after the midterms, the S&P 500 rallied 1.6% and the Dow jumped about 1,500 points. Thursday gave all of it back and more. As the size of the Democratic sweep sank in, investors started to worry that data center construction could slow, and the AI trade broke hard. The S&P 500 fell 4.4% and the Dow lost about 1,833 points, the worst day for both since April 2025. The Nasdaq fell 5.5% and closed in correction, more than 10% below its October high. The Philadelphia semiconductor index dropped 12.3%, its worst day since March 2020, and Nvidia fell 9.2%. Friday the chip names bounced, with Nvidia up 2.8% and the semiconductor index up 4.2%, but the rest of the market was mixed.
How price behaved at the levels that mattered
Last week I had the old floor at 7,612 to 7,631 overhead, with 7,765.36 above it. Beneath, Friday's low of 7,527.56 and the September 16 low of 7,507.77.
Monday opened at 7,610.83, right at the old floor, poked up to 7,662.23, then sold off to close at 7,541.40, near the low of the day and about 34 points above the September 16 low. Tuesday's low of 7,545.39 held. Wednesday the post-election rally pushed price back above the old floor to a high of 7,715.57, still short of 7,765.36. Then Thursday cut straight through everything. The S&P 500 opened at 7,678.72, sliced through the old floor, last Friday's low and the September 16 low in one session, and closed at 7,353.73, near its low of the day at 7,350.35. That was the lowest close since July 29. Friday stayed inside Thursday's range. The low of 7,369.55 held above Thursday's low, buyers pushed it up to 7,444.20, and price faded back to close at 7,376.86, near the bottom of the day. The S&P 500 is now about 5.7% below its record close from October 6.
The lesson from Thursday is simple. Levels that held for weeks can give way all at once on a news day.
What showed beneath the surface
Thursday was a broad selloff, not just a tech selloff. All 11 S&P 500 sectors fell. Technology fell 7.3%, its worst day since March 2020. On the New York Stock Exchange, 2,344 stocks fell and only 416 rose, almost 6 to 1. Friday's bounce was narrow. Within the S&P 500 more stocks fell than rose, and Nasdaq's gains faded into the close. For the week, Morningstar's sector data showed energy down 12.3% and technology down 6.7%, while communication services gained 5.3% and consumer cyclicals 2.4%.
Volatility jumped. The VIX closed Wednesday at 16.61, then jumped more than 11 points Thursday to 28.18, its highest level since March 31. It eased to about 25.6 Friday, still well above last week's 19.42.
Rates eased for the week, and the jobs report pushed them back up a little Friday. October payrolls rose 165,000, far above expectations, and unemployment fell to 4.1%. Traders added to bets on a Fed rate hike in December. The 10-year Treasury yield finished at 4.86%, down from 4.94% a week earlier. The 2-year finished at 4.51%, down from 4.56%.
Oil gave back its war premium. WTI settled at $90.83 Friday, down 12.8% for the week from $104.12. Brent settled at $98.32, down about 13% on the same contract and back under $100. Reuters called it Brent's steepest weekly drop since the start of the pandemic, as the election results raised hopes of a diplomatic path with Iran. Comex gold went the other way, settling at $4,064.50, up 4.6% for the week. The dollar index finished near 102.30, up from 101.88 a week earlier.
The week ahead: what I'm watching
The big event is October CPI on Tuesday morning, before the opening bell. All times are Eastern.
- Monday: Fed Vice Chair for Supervision Michelle Bowman speaks at 8:40 AM. September wholesale inventories at 10:00 AM, with Chicago Fed President Austan Goolsbee at 10:00 AM and Richmond Fed President Tom Barkin at 12:15 PM. Barrick Mining and Ferguson report before the open. Take-Two Interactive and Occidental Petroleum report after the close. KKR, NRG Energy and Constellation Energy also report.
- Tuesday: NFIB small business optimism at 6:00 AM. October CPI at 8:30 AM. FactSet's estimate calls for 3.9% over the past year, up from 3.7%, with consensus near 0.3% for the month after 0.6% in September. CoreWeave reports after the close with its call at 5:00 PM.
- Wednesday: Veterans Day. The stock market is open regular hours, but the bond market is closed under SIFMA's recommendation, so there are no Treasury quotes that day. No major economic reports.
- Thursday: Weekly jobless claims at 8:30 AM and existing home sales at 10:00 AM. Cisco reports after the close with its call at 4:30 PM. Applied Materials also reports.
- Friday: October PPI at 8:30 AM. Consensus calls for 0.4% for the month after 1.3% in September.
The levels on my screen: On the S&P 500, Friday's high of 7,444.20 overhead, then the 7,508 to 7,545 zone, where the September 16 low and this week's Monday and Tuesday lows now sit above price. Above that, Wednesday's high of 7,715.57 and the 7,765.36 ceiling. Beneath, Thursday's low of 7,350.35, then the 200-day simple average near 7,325, then the July 29 low of 7,313.92. On the Nasdaq, Thursday's low of 24,262 and Friday's high of 24,826. On the VIX, 30 above and 20 below. On rates, 4.84% on the 10-year, Thursday's close. On oil, $90 on WTI and $100 on Brent.
None of this is a forecast. It is where price is and what is on the calendar. After a week like this one, let the open settle, wait for price, participation and volatility to agree before adding risk, and remember that cash is a position.
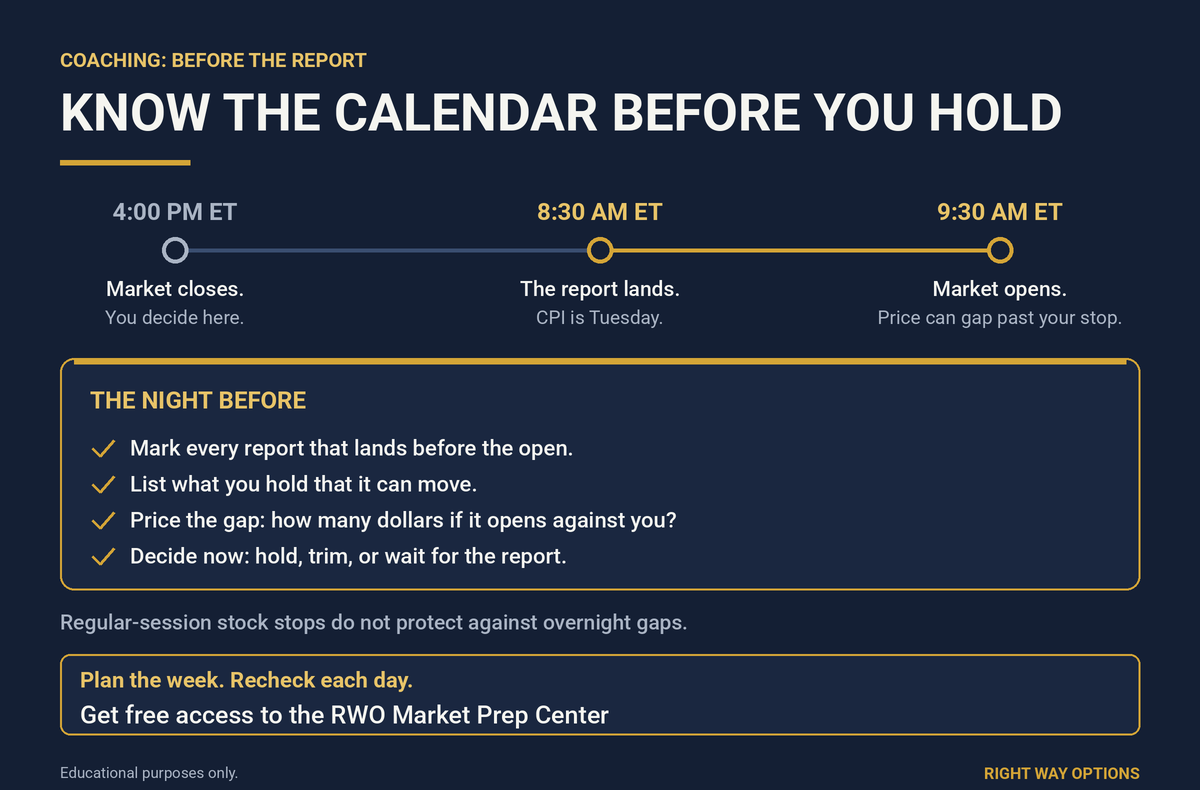
Coaching: know the calendar before you hold
Get free access to the RWO Market Prep Center
Most traders plan the entry and forget the calendar. Tuesday's CPI report lands at 8:30 AM ET, an hour before the stock market opens. If it surprises, the stocks you hold can gap right past your stop. An ordinary regular-session stock stop does not protect you while that session is closed, and the opening fill can be far from your stop price. Thursday showed how fast levels give way on a news day.
Start before the week begins. Mark the reports and earnings that could affect what you hold, then recheck the calendar as the week unfolds. The free RWO Market Prep Center can help with that routine. It brings together economic reports, earnings, volatility and market context so you can prepare before turning to your charts. Use it to help with your preparation, not to predict the next move.
Each night, look at your positions and ask one question: if this opens against me, how many dollars do I lose? If that number is bigger than what you planned to risk, decide now whether to hold, trim, or wait until the report is out. A decision made Monday night is a plan. A decision made at 8:31 Tuesday morning is a reaction.
Get free access to the RWO Market Prep Center
Doug
Educational purposes only. Nothing provided by Right Way Options constitutes investment advice or a recommendation to buy or sell any security. Trading involves risk.